
SGU is the largest source of physicians for the entire US workforce.1
1) According to FSMB physician licensure data, 2023.
St. George’s University has over 25,000 School of Medicine graduates in the US and around the world.2
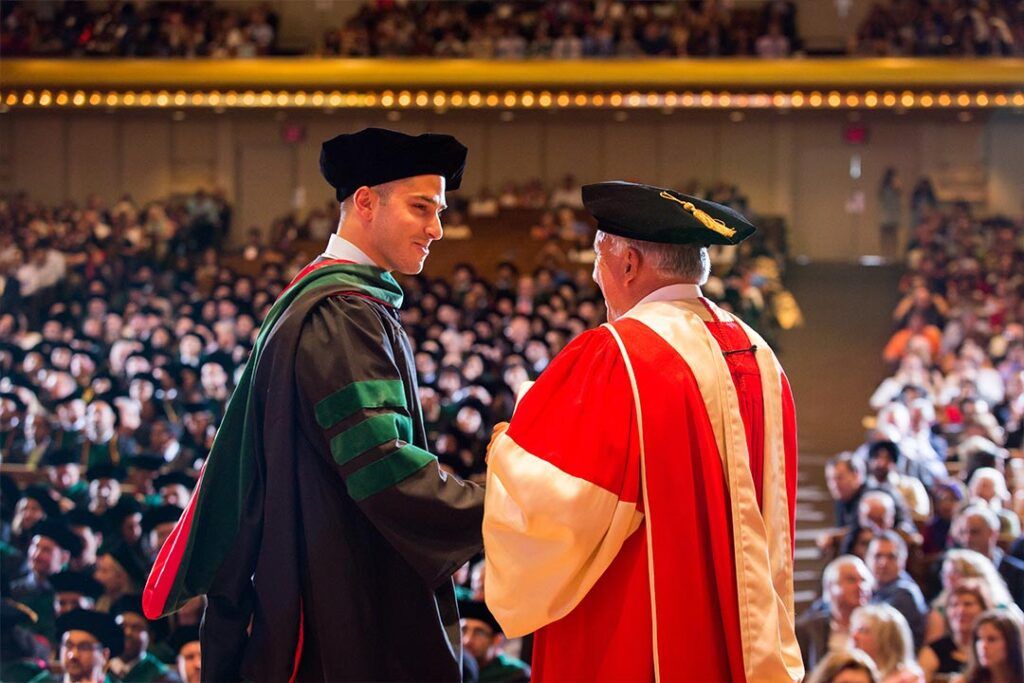
There’s a bright future for St. George’s University Students and Grads. Students from across the world come to St. George’s University for a rewarding education with global impact.
2) Based on the number of students who have completed the Doctor of Medicine program from 1981-2025.
1,049+
US residencies in 2025. No other medical school in the world provides more new doctors to the US healthcare system.
) As the medical school graduating the largest number of students per year, SGU places the largest number of graduates into residency programs each year, based on internal SGU graduate/expected graduate and residency placement data as of September 2025.
95%
US residency placement rate for US graduates over the last five years.
) Average of 2021, 2022, 2023, 2024 and 2025 residency placement rates. Residency placement rate is defined as the total number of US students/graduates who obtained a US residency divided by the total number of US students/graduates who applied to a US residency program in a given year as of September 2025.

82%
Pass rate of SGU students from the US taking the USMLE Step 1 for the first time 2020-2024 had an 82% pass rate
) Total results from the five calendar years 2020-2024. First-time pass rate is defined as the number of US students (US citizens/permanent residents) passing USMLE Step 1 on their first attempt divided by the total number of US students taking USMLE Step 1 for the first time within the given time range. In order to be certified to take USMLE Step 1, students are required to pass all basic sciences courses.
Easing the Physician Shortage Burden
A recent report by the Association of American Medical Colleges predicts that the US alone will have a shortfall of between 37,800–124,000 physicians by 2034. St. George’s University continues to do our part to alleviate this shortage. According to a recent publication, St. George’s University is the largest source of doctors for the entire US workforce, as well as the number one provider of new primary care doctors into the US each year. With this extensive network of graduates, a strong and expanding clinical program, excellent student support services, and a consistent record of residency placement, our current and future students are in a great position for success.

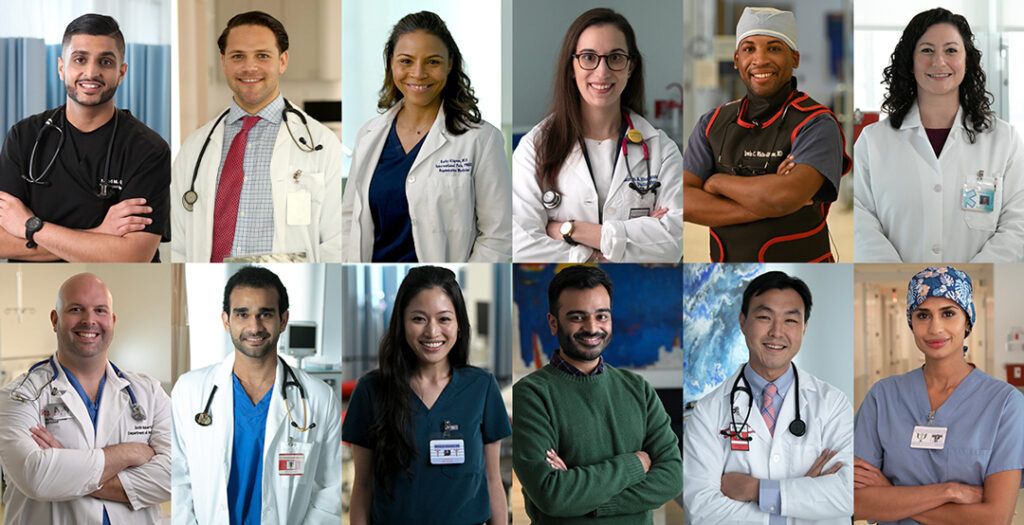
Why Students Choose SGU
With outstanding faculty and award-winning student support services, SGU students are prepared to practice worldwide.
Unique and Unparalleled System of Support
SGU’s Department of Educational Services (DES), a pioneer in the development of student support services, has been recognized by the National Academic Advising Association (NACADA). The DES provides access to small study groups and more than 450 workshops each week to help ensure student success. Services focus on such topics as:
- Time management
- Study skills
- Test-taking skills
- Note-taking skills
- More efficient learning techniques
The department’s unique and highly effective faculty is the largest on campus and is an important component of our student and graduate success. Close to 100 percent of the University’s students avail themselves of the support offered through a variety of innovative programs.
Office of Career Guidance and Student Development
The Office of Career Guidance and Student Development assists medical students from the time they step foot on campus to residency and beyond. Services include:
- Preparation for USMLE and licensure exams
- Scheduling of clinical rotations
- Residency application process
- Counseling in specialty and residency selection
Faculty
The faculty is highly qualified, dedicated to teaching, and committed to learning and utilizing the best teaching techniques of the 21st century. SGU’s School of Medicine has nearly 2,000 campus-based and clinical faculty who service the student body, and faculty members with professorial rank have terminal degrees—a PhD, an MD or equivalent, or both. Distinguished visiting scholars—from such highly regarded institutions as Cambridge University in the United Kingdom and Harvard University, Georgetown University, and Emory University in the United States—have lectured in the School of Medicine.
Financial Aid
St. George’s University is one of a few international universities recognized by the US Department of Education to administer student loans for qualified US students. In its history, the university has provided more than 5,000 students with academic scholarships, and has granted more than USD$100 million in scholarships. More than 75% of all entering four-year MD students received SGU scholarships in the 2020-21 academic year.
Graduation Rates
82%
SGU’s School of Medicine graduation rate is 82% for all students who began in academic year 2018-2019.
Based on the number of students who have completed the Doctor of Medicine (MD) program as of September 2025.
87%
SGU’s School of Veterinary Medicine graduation rate is 87% for all students who began in 2019.
Completed the Doctor of Veterinary Medicine (DVM) program to date.
Federal Loan Credit Default Rates
0.9%5
SGU’s School of Medicine US Title IV federal student aid cohort default rate is below one percent (0.9%) for federal fiscal year 2018, the most recently available data, which is below the “national cohort default rate” at schools participating in US federal loan programs (7.3%)2 for that year.
5) The US Title IV federal student aid cohort default rate is the percentage of a school’s US Title IV eligible borrowers who enter repayment during a particular federal fiscal year and default on their federal student aid obligations. SGU students who are US citizens or permanent residents and are enrolled in the four-year medical degree program are eligible to receive US federal aid. 2 Most recent data available at Official Cohort Default Rates for Schools. The default rate for schools participating in US federal loan programs is inclusive of all eligible federal aid programs at such institutions (undergraduate, certificate, graduate, and professional). SGU’s School of Medicine cohort default rate represents its four-year medical degree program.
0.0%6
SGU’s School of Veterinary Medicine US Title IV federal student aid cohort default rate* is 0.0% for federal fiscal year 2018, the most recently available data, which is below the “national cohort default rate” at schools participating in US federal loan programs (7.3%)≈ for that year.
6) *The US Title IV federal student aid cohort default rate is the percentage of a school’s US Title IV eligible borrowers who enter repayment during a particular federal fiscal year and default on their federal student aid obligations. SGU students who are US citizens or permanent residents and are enrolled in the 4-year veterinary medical degree program are eligible to receive US federal aid.
≈ Most recent data available at Official Cohort Default Rates for Schools. The default rate for schools participating in US federal loan programs is inclusive of all eligible federal aid programs at such institutions (undergraduate, certificate, graduate, and professional). SGU’s School of Veterinary Medicine cohort default rate represents its 4-year veterinary medical degree program
Facts & Figures Verification
St. George’s University has retained the services of Summit Consulting, LLC, a quantitative and qualitative consultancy, to independently verify statistics used on this website on an ongoing basis. Where applicable and noted, Summit has examined the relevant data and confirmed the accuracy of the statement.
The statements below have been reviewed and verified by Summit Consulting, LLC
- SGU provides the largest number of graduates to US residencies each year, for the past 11 years.
- SGU is the largest source of physicians licensed (and active licenses) in the US—more than any other medical school in the world.
- Number of SGU SOM graduates placed into residencies per year (annually & 5 yr avg) broken down by citizenship/source country (US, Int’l, Canada, Caribbean)
- SGU SOM Residency attainment rates (annually & 5 yr avg) broken down by citizenship/source country (US, Int’l, Canada, Caribbean)
- Annual residency placement #’s broken down by citizenship/source country (US, Int’l, Canada, Caribbean)
- USMLE Step 1 & 2CK (annually & 5yr) broken down by region (US, Int’l, Canada)
- SGU SOM graduates have practiced at all US News and World Report Top 20 US Hospitals
- Breakdown of # of SGU’s grads by school by US, Canada, and Int’l
- For each SGU school, US states and countries where graduates have practiced around the world.
- SGU’s School of Medicine graduation rate is 82% for all students who began in academic year 2018-2019.
SGU’s School of Veterinary Medicine graduation rate is 88% for all students who began in Academic Year 2017.
From Dr.eam To Doctor
Learn more about our MD program and tracks
Every aspect of our MD program and tracks are intentionally designed to support you on your path to becoming a physician.
Flexible Start Dates: Choose from multiple entry terms in August, January, or April to begin your medical education at your convenience.
Average of 2020, 2021, 2022, 2023 and 2024 residency placement rates. Residency placement rate is defined as the total number of students/ graduates who obtained a US residency divided by the total number of students / graduates who applied to a US residency program in a given year as of October 2024.
Program and Track Highlights
- Global Recognition: SGU’s School of Medicine has been continuously accredited for decades, enabling our students to be eligible to practice in the US.
- Clinical Training: 85+ hospitals and health systems in the United States, Canada, and the United Kingdom offer clinical and ambulatory training and support
- Legacy of Excellence: Join the network of over 25,000 graduates* who have impacted healthcare worldwide.
*Based on the number of students who have completed the Doctor of Medicine program from 1981-2025.
Connect With Us.
- Learn more about our MD program and tracks
- Receive priority invitations to our prospective student events
We will be in touch soon, but if you have questions now, email us at admissions@sgu.edu